State of The Market - March 2025

Download the PDF
Public Markets
As everyone here knows, there are increasingly concerns at a macroeconomic level which have largely been driven by the “will he or won’t he” question on tariffs and to a lesser extent DOGE related spending cuts.
A number of notable macro investors and economists have come out as bearish in the last few weeks, but this is obviously changing by the day.

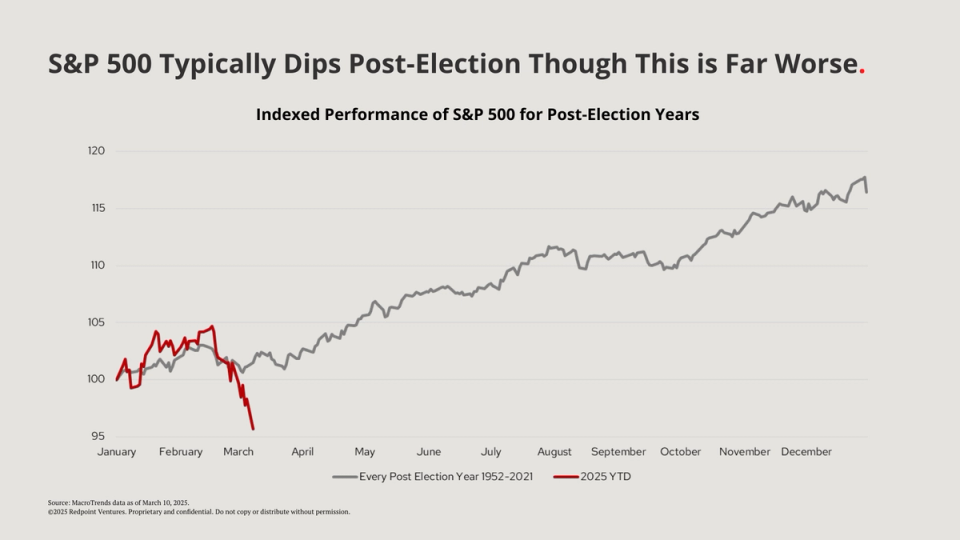
Obviously, this uncertainty has led to a major market pullback. While we usually see a dip in S&P 500 performance following an election, this year has been more extreme than historical trends.
We’re also seeing far more negative sentiment1 from CEOs. In just January, Stanley Druckenmiller said that this was the most “pro-business administration in our lifetime,” and now we have a real lack of confidence from CEOs about the next 12 months.

It’s important to note that this still is a relative blip. Despite the recent volatility, the NASDAQ is still near its all-time highs. The NASDAQ is only back down to a level of where we were in September of this past year, and we’re still up 7% over the last 12 months.

Consistent with the last couple of years, the run-up hasn’t been evenly distributed. The Magnificent 7 has driven the lion’s share of the growth in the S&P 500 the last few years and currently represents about a third of the total market cap in the S&P.
While the Mag7 is up quite a bit in the last 5 years, it’s been hit disproportionately hard since the Inauguration, down 16% since January 20th.

When looking at the composition of public tech companies, one fairly recent phenomenon is that there aren’t a lot of true growth opportunities in the public markets. The median growth rate for public tech companies today is only 10%, and only 9% of companies are expected to grow over 20% in the next few years.
There are a few factors at play:
- The global economy is a bit more muted.
- The businesses that are currently public are more mature, as there haven’t been many IPOs of late. The ones that have gone public of late are far larger than in the past.
- The trade-off between growth and profitability

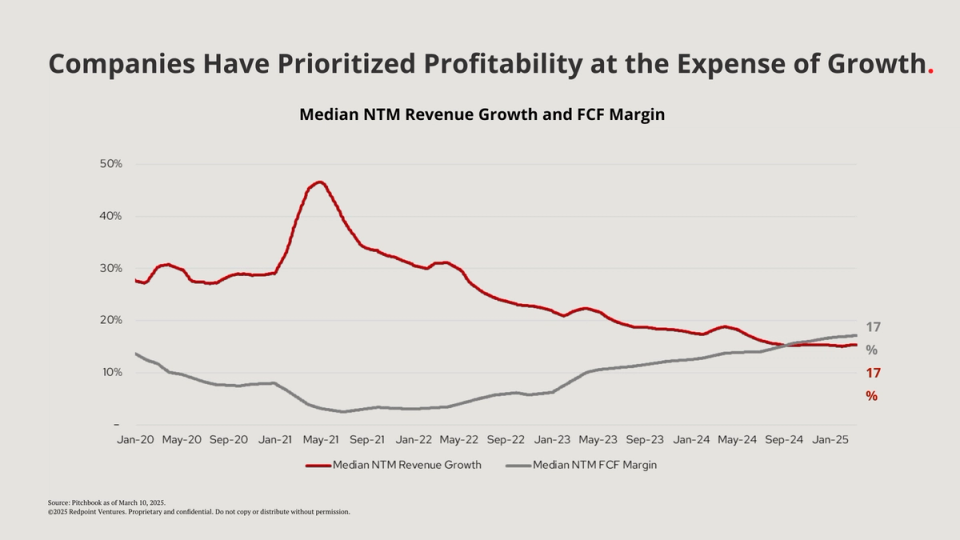
In the public markets, we’ve continued to see companies prioritize FCF at the expense of growth, which has included layoffs or hiring freezes. This has led to more muted growth, and the public market has responded accordingly.
We’ve also seen a lot more predictability in the public markets than in recent years. More companies are hitting their numbers now than at any point since 2021. This is likely a mix of a better buying environment, as well as a reset of expectations.

There is also a real stratification between the top software companies and the rest of the pack.
The following chart shows the top 10 software names versus the rest of the pack, and the spread between these names is large even despite the recent sell-off.
The market remains broken into a world of the “haves and have-nots”

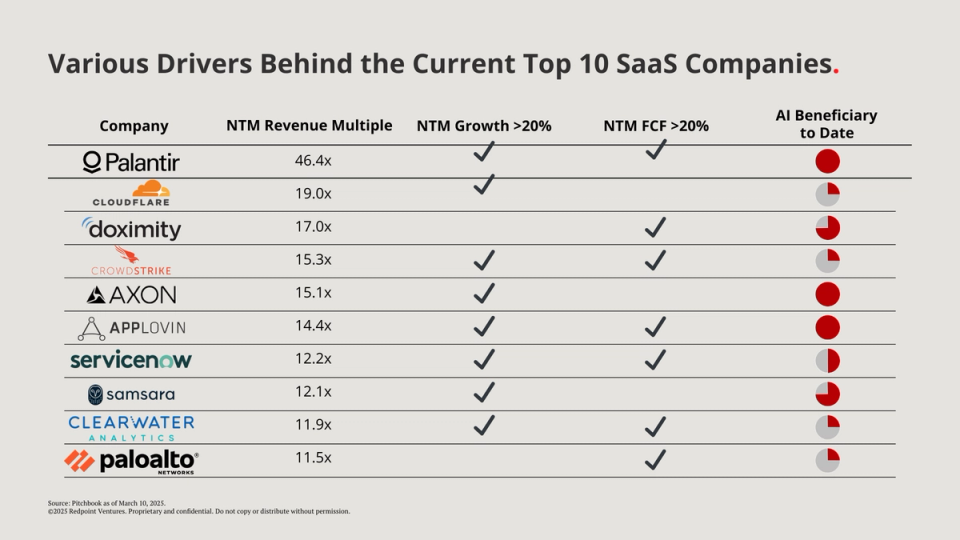
If you unpack the characteristics of these top 10 SaaS companies, you'll see two interesting things.
First, these businesses are growing significantly faster with far better FCF margins than the rest of the market.
Second, these businesses are simply far bigger than the top 10 companies that you’ve seen in the past. The size of these businesses is almost 10x larger than the remaining SaaS universe, which is the biggest spread we’ve seen in recent years.

Within the top 10 SaaS companies, value creation has largely been driven by a combination of strong growth and strong FCF margins. 8 of the 10 public names here have growth rates above 20%, and 7 have FCF above 20%.
In addition, one of the biggest value drivers for a handful of these companies has also been their ability to execute on the AI opportunity in a short time horizon.
Unsurprisingly, the main themes tech companies are focused on include AI, the macro environment, and operational efficiency, and these themes dominated discussion at the recent Morgan Stanley TMT conference.
This further highlights the key areas of emphasis and value drivers that are top of mind for tech companies right now.

Across the board, public market outcomes are simply far larger than they have been in the past.
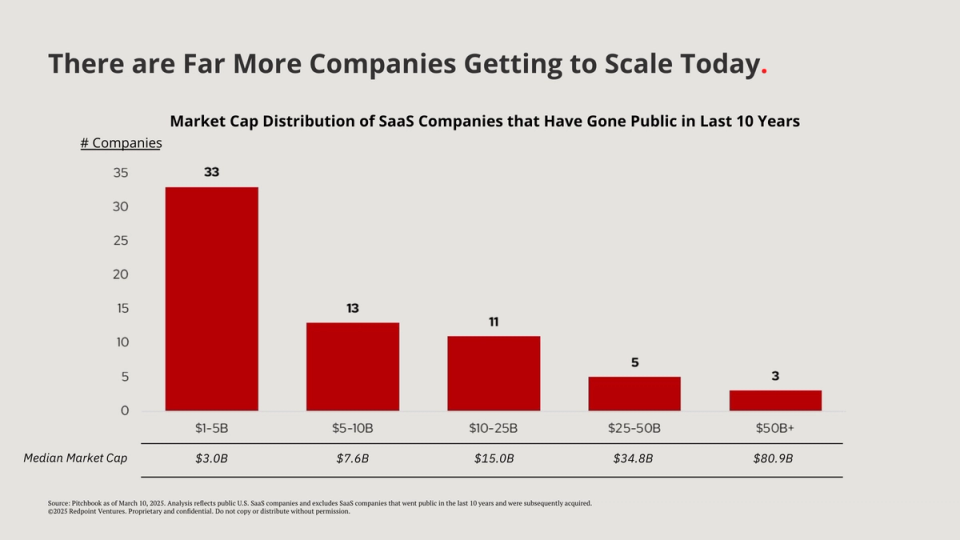
The following graph shows SaaS companies that have gone public in the last 10 years. About half of these businesses are worth over $5B, and over 10% are worth over $25B.
For investors, there are a number of opportunities to hit base case return in the $1-10B range, but there are also some massive companies that can drive very outsized returns. More names will hopefully join the list soon.
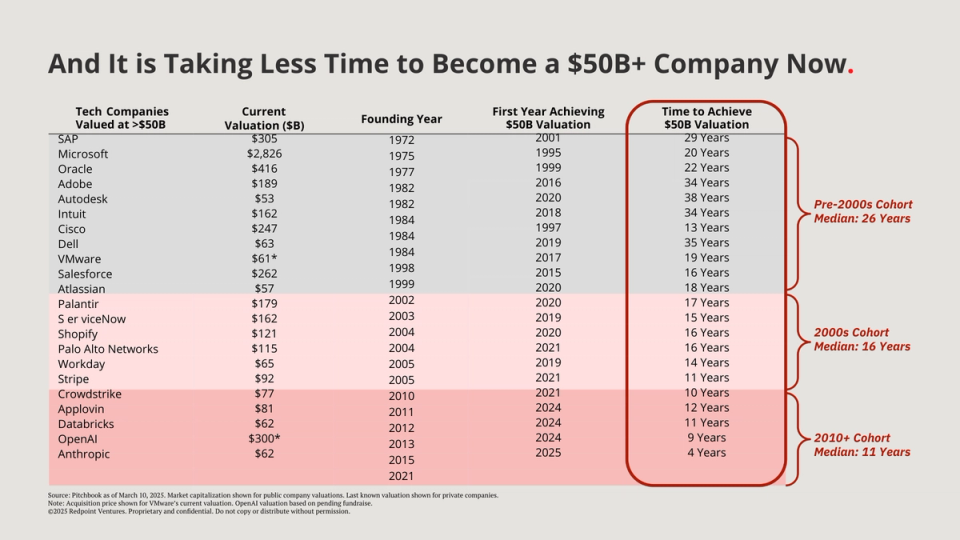
There aren't just more companies that are worth over $25B or $50B, these companies are reaching a valuation of $50B far faster than ever before.
The following chart shows different B2B technology companies currently worth over $50B and how long it took them to reach that level.
You’ll notice the cohort of businesses founded pre-2000s took a median of 26 years to get a $50B valuation. The companies that were founded in the 2000s took 16 years on average, and more recently, the 2010s cohort has taken only 10 years to get to a $50B valuation.
Private Markets
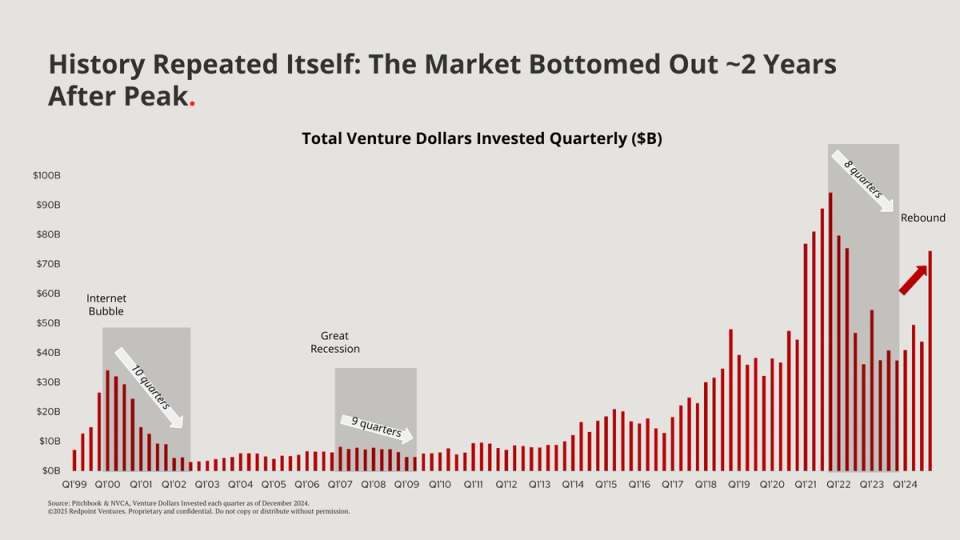
Over the last few years, we saw the peak to trough in a venture correction typically takes 2 to 2.5 years.
This played out with this cycle with the market rebounding after 8 quarters, as it rebounded significantly at the end of Q4 of 2024.
The good news: it’s not just venture investing recovering. Software selling is also improving too.
The following graphs show the rep attainment by quarter for software businesses provided by our portfolio company Bravado. As you can see, there’s been a marked improvement in 2024.
In Q4 2024, 57% of reps hit their quota, which is almost double the percentage we saw in Q4 of 2023.

In the past couple of years, we also saw a reset in venture deal activity. In 2024, Series A activity stabilized. It's still below pre-COVID levels, but it appears we are past the bottom.
At Series B and C, we have started to see a rebound from the absolute lows.
Anecdotally, our team has seen these trends continue so far in 2025 as our deal activity remains strong.

From a valuation perspective, it does feel like we’re settling into a new normal in the private markets. Private multiples at Series B and C have come down meaningfully from 2021 levels, but they remain significantly above pre-COVID levels.
The spread between public and private also remains elevated, but it has shrunk over the last year.
It’s important to tie this data with the lack of growth in the public markets. Private companies at Series B and Series C levels are still growing at very healthy levels, whereas there is very little growth in the public markets. So on a growth-adjusted basis, we feel that this environment is far more “reasonable” than what we saw in 2021 and 2022.

As you'd expect within our core deal universe, AI has become extremely prevalent with it comprising roughly 50% of the opportunities that we’re looking at, which is up from 31% in 2023.
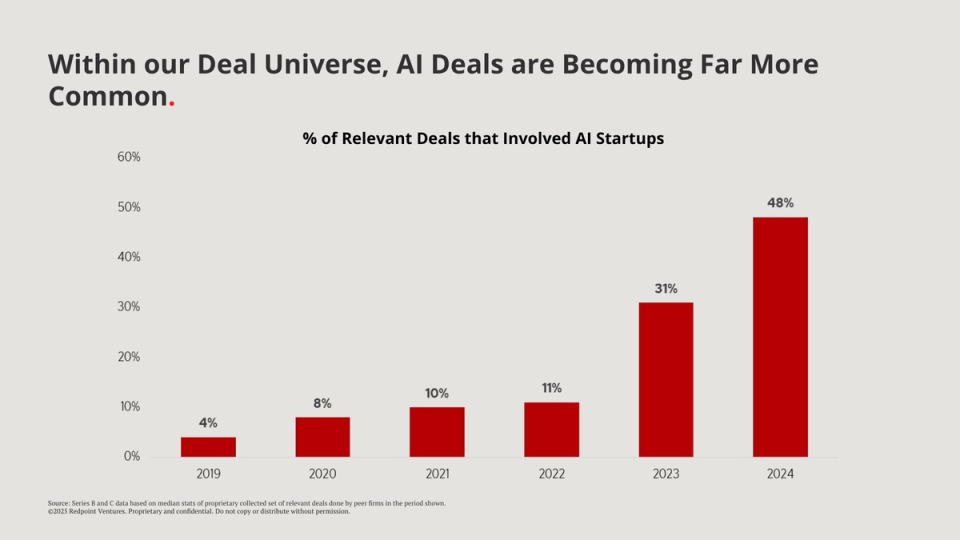
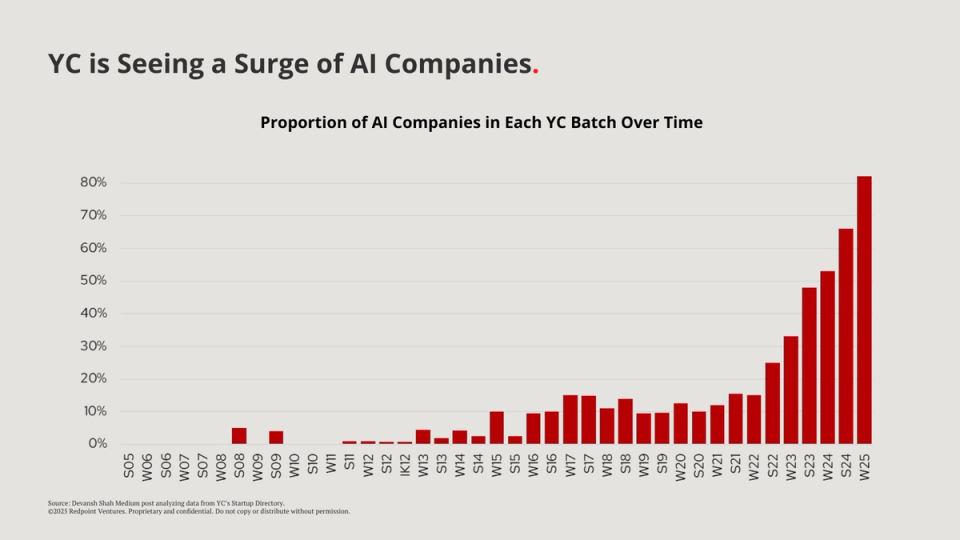
We expect the above trend to continue. The data shown focuses on the stage of market we focus on, but this trend is obviously true at other stages as well. In fact, upfunnel, 82% of companies in the most recent YC batch were AI companies.
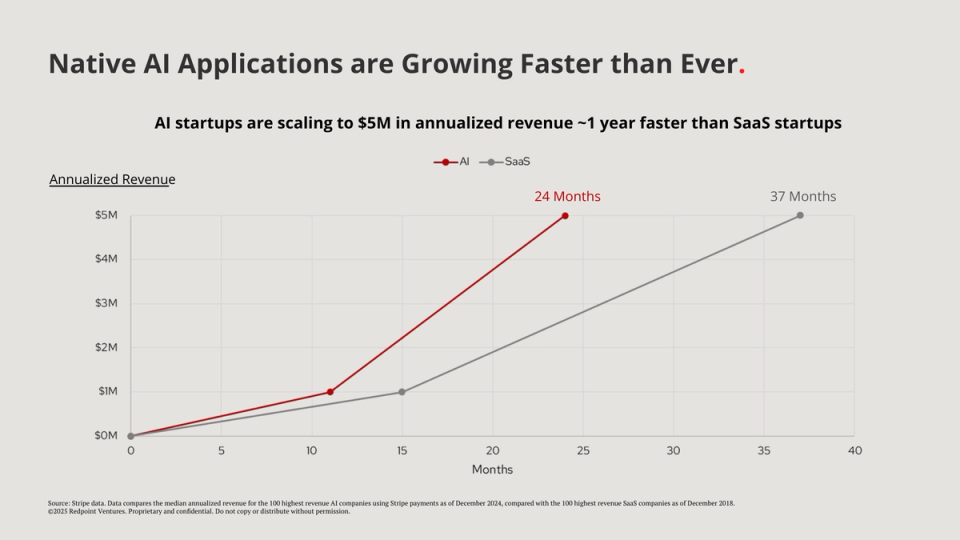
These AI businesses are growing far faster than other companies.
Here's some data from Stripe1 comparing the highest revenue AI companies that use Stripe with the equivalent high growth SaaS companies from a prior generation.
Top AI companies are reaching $5M in annualized revenue 13 months earlier than the prior SaaS cohort.
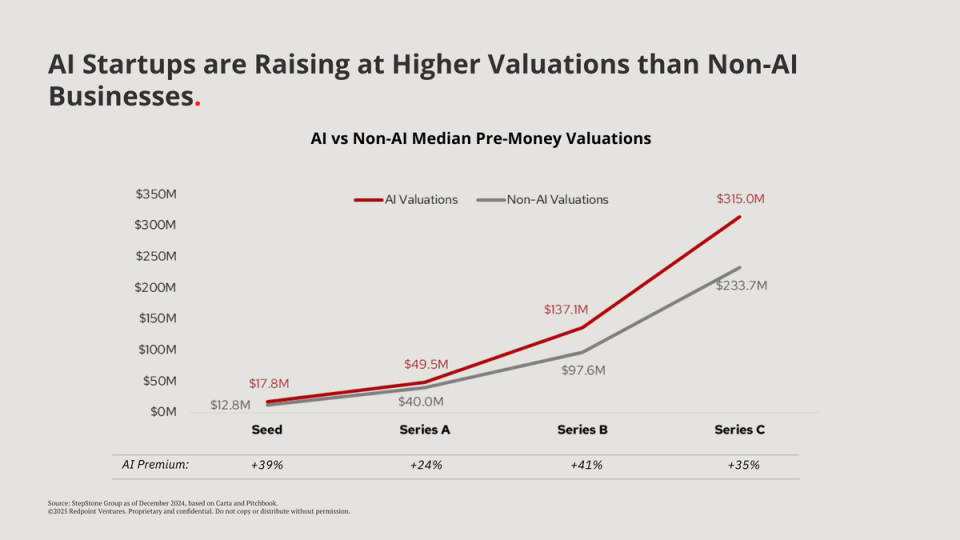
Perhaps unsurprisingly, due to the growth rates and potential opportunity, we’re seeing AI companies raising at higher valuations. The following data from Carta shows seed through Series C valuations, where you’ll see a premium of anywhere from 24% to 40%. However, we actually think that this is quite understated.
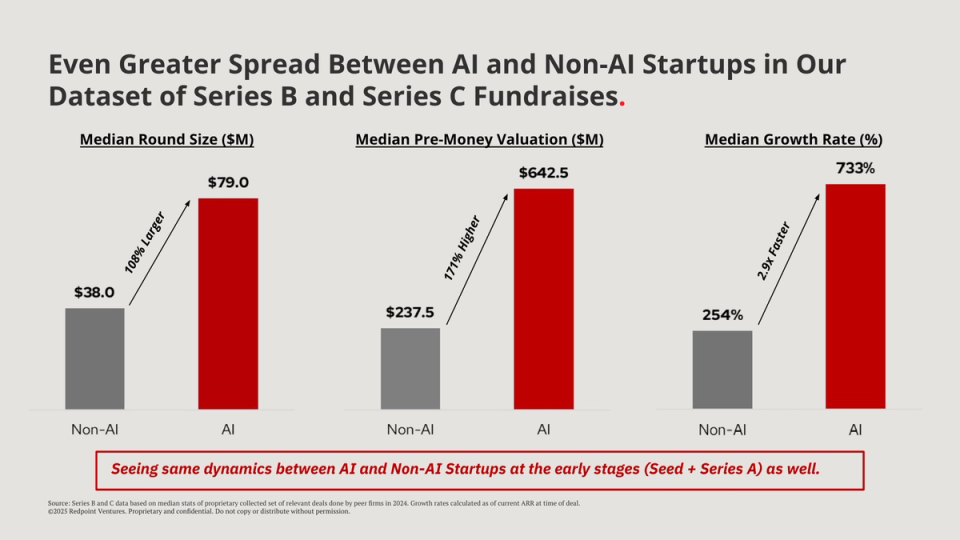
Within our core deal universe of the top 10% of deals, that trend is even more pronounced. AI companies are consistently raising larger rounds, at higher valuations.
Most importantly, they’re also growing meaningfully faster than non-AI businesses and far faster than the data that Stripe showed.
One other notable trend in the private markets: startups simply have access to more capital than ever before. The next chart shows some of the largest fundraises over the last year.
The access to capital is allowing companies to delay going public and fund significant secondary purchases or capital for compute that simply would not have been possible in the past.
More on this in the liquidity section below.

With some of these massive fundraises, we’re also seeing significant concentration of venture capital into a select few private tech leaders.
The trend has accelerated meaningfully in the last couple of years, with 31% of total venture capital being invested into 20 companies in 2024.
Exits and Liquidity
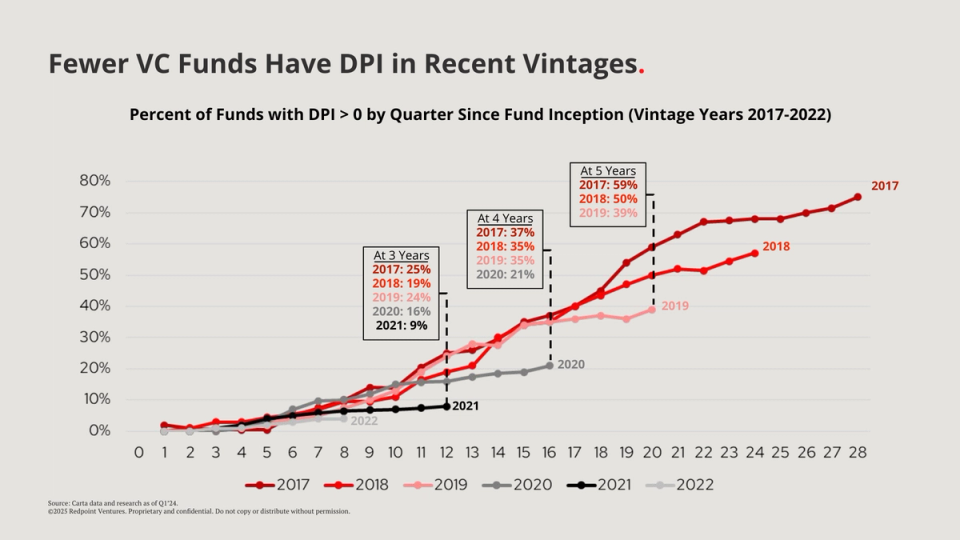
Carta published data last year that shows something we’ve all been aware of in venture the last few years. With a weaker IPO and exit environment, liquidity has been harder to come by, and recent venture vintages have struggled to produce DPI.
The percentage of recent vintages that have produced any DPI is at all time lows and well behind where older vintages (like 2017-2018) were 3 to 5 years after fund activation.
Startups are generally pursuing three main paths to liquidity—but beyond that, there’s a growing group of companies with uncertain outcomes, which we’re referring to as “Zombieland.”
Thank you!